UPX [1] is one of the most common packers used by malware authors to obfuscate their binaries. Obfuscated binaries are harder to analyze than the original binary. UPX is a packer, so it does have legitimate usage like compressing a binary for reduced file size. Not all UPX packed files are malicious but for this blogpost, we will be choosing something malicious.
UPX packed executables can be automatically unpacked by UPX tool (which available online for free). To prevent this, malware authors often tamper with the packed binary in such a way that they can’t be unpacked by UPX tool but the binary unpacks itself in memory without any issues. So, learning to unpack them manually always helps. Moreover, the general principle mentioned below can be used to unpack any custom packer or obfuscation techniques used by malware authors.
I took a long time to search for a sample malicious file and in the end, chose one randomly in VirusTotal (VT) by searching for “UPX Ransomware” [2]. I used Detect It Easy (DIE) [3] tool to confirm that the binary is UPX packed.
For the purpose of this post, I’ll be using packed and obfuscated interchangeably. I’ve renamed the downloaded binary to “sample”. Using the long hash value as the binary name makes the x32dbg debug windows look cluttered as the function names are referred to as filename.memory_address in the debugger.
Theory Crafting
Before we proceed, we need to talk about how a packed binary is unpacked. A packed binary, when executed (starts from a point called Entry Point - EP), allocates memory space to unpack itself and then populates it with the unpacked instructions. This process of writing to the memory is unpacking.
Once unpacked, the packer will start executing instructions from the unpacked section (The starting address is called Original Entry Point - OEP). By debugging the packed executable, we can execute/debug until we can identify the OEP. Once we identify OEP, we can dump the instructions into a binary file and this is the unpacked code. This can be considered as the standard process for unpacking manually.
We already know it’s packed. If we did not know that, we can use a tool like PeID [4] or Detect It Easy to check for packers. Before we start debugging, let’s take a look at the packed binary in the tool - PeStudio. It gives us a quick look at the PeFile structure, strings and imported libraries. Each of these sections provides us with more context to focus on while analyzing the binary.
Pe File Structure
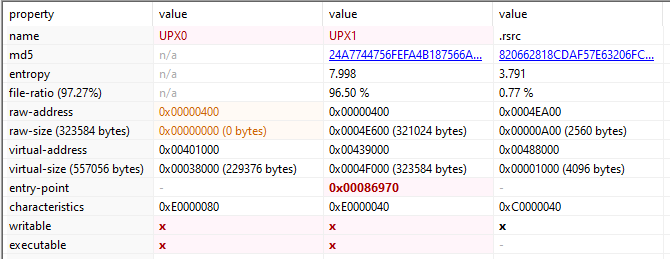
The basic unit of code within a PE file is contained within a section [5]. There are 3 sections, UPX0, UPX1 and .rsrc in the packed binary. Sections being named as UPX is a hint to what packer might be used.
Warning: PE File section names can be anything and is not a reliable indicator of the contents within.
The section UPX0 has raw size of 0 bytes but virtual size of 0x3800 bytes. And the section UPX1 has 96.5% entropy. High entropy value indicates packed or encrypted data. In this case, the packed data in UPX1 will be unpacked into the empty space of UPX0.
Note: Sections with high entropy indicate compressed or encrypted data. Sections with 0 raw size but large virtual size might be used to write instructions dynamically and execute them during runtime.
Strings
It shows 3935 strings, but majority of it is unreadable/gibberish. The small percentage of readable strings also indicates that binary might be obfuscated. There is not much more to do here, let’s move on.
Imports
PeStudio shows only 15 functions imported. The small number of library imports is another indicator of packed or obfuscated content. Malicious files might often contain obfuscate module and library names (won’t show up in simple string analysis). These obfuscated libraries names, can then be deobfuscated during runtime and then loaded using LoadLibraryA api call followed by GetProcAddress to obtain the address to specific module/function within that library.
This binary has the following interesting imports
- VirtualProtect
- VirtualAlloc
- ShellExecuteW
- LoadLibraryA
- GetProcAddress
These are sufficient for the binary to unpack itself in memory and run the deobfuscated code. For the sake of this blogpost size and your time, I’ll not go into details of how they are used. We can discuss them in future posts.
Unpacking UPX Manually
Identifying OEP
Let’s load the binary into x32dbg. As soon as it is loaded, the execution is paused at the very beginning. As stated above, the next set of instructions are meant to unpack the original binary instructions and execute them. So, we are looking for an unconditional jump or a call instruction to a specific memory location.
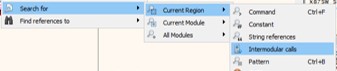
You can verify that you are still in packed section of instructions by searching for the “Intermodular calls” and “String references” in the “current region”. Both these will open a new window displaying limited data. This is an indicator that you are still in packed executable region.
Continue to “step over” the instructions to avoid jumping into function calls. As you continue, keep an eye on the title of the debugger. If it has ntdll.dll or some other system library, it means you are in the library code and that does not interest you (usually) as a malware analyst. You can select “Run to user code” to get back to your binary code.
After a few step instructions, you’ll notice that you are now at the very end of the binary. If you scroll further down, you’ll notice an unconditional jump right before a series of opcodes 0000 signaling the end of the binary.
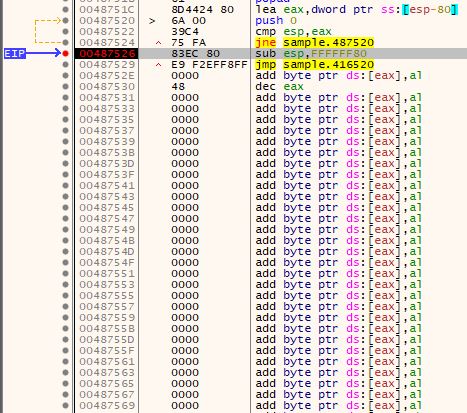
Set a breakpoint right before the jmp sample.416520 instruction and check for intermodular calls again. You will still see limited number of calls indicating packed data. Now, step over this instruction, which will jump or change the instruction pointer to a new location.
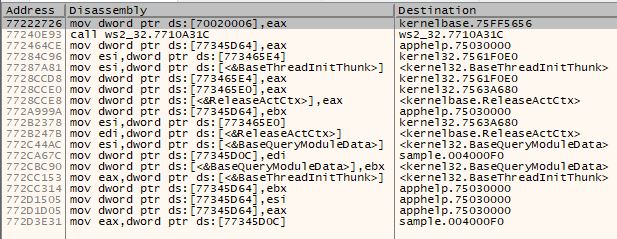
This new location is the beginning of the the unpacked called or also called as OEP. the address location 0x416520 is the OEP where the unpacked code (instructions) resides. You can (and need to) verify this by checking for intermodular calls which will show a larger number of function calls, indicating that the binary has been packed.
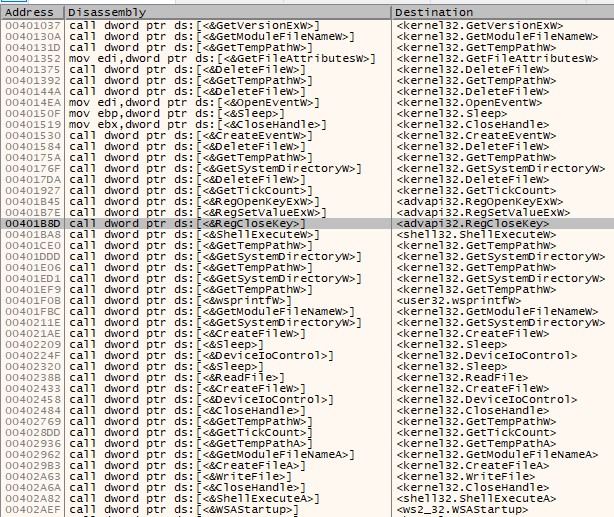
Note: Figure 5 has significantly greater number of function calls than Figure 3. Furthermore, the function names are indicated clearly and not obfuscated. This indicates that we have successfully unpacked the binary.
Before we proceed, make sure your Instruction Pointer is pointing to the OEP we have identified above.
Dump Unpacked Binary From Memory
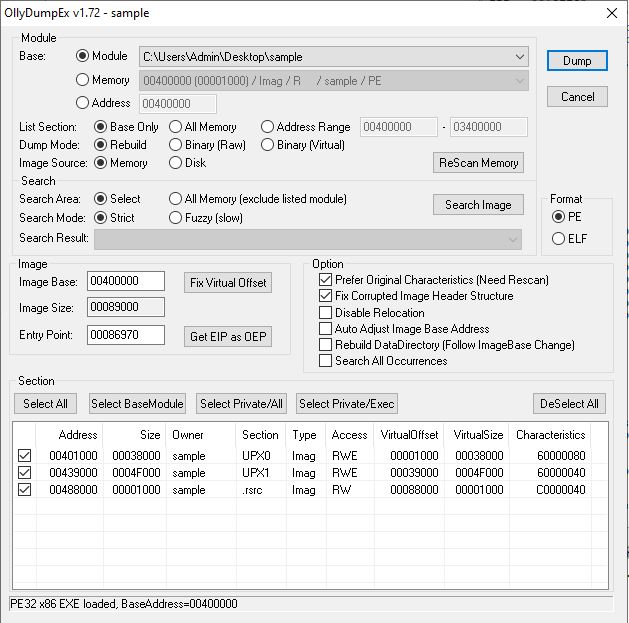
Once we have the unpacked binary instructions and the instruction pointer is pointing to the OEP, we can use the “OllyDumpEx” plugin [6] for x32dbg to dump the process to a file. Make sure that the OEP is pointing to the very first instruction after the Jump instruction we previously identified. This makes sure that we are dumping only the unpacked code in memory to a file. This plugin takes care of building the PE file structure around the dumped file. There is no need to change any parameters in the OllyDumpEx window. Select Dump and you will have the unpacked binary.
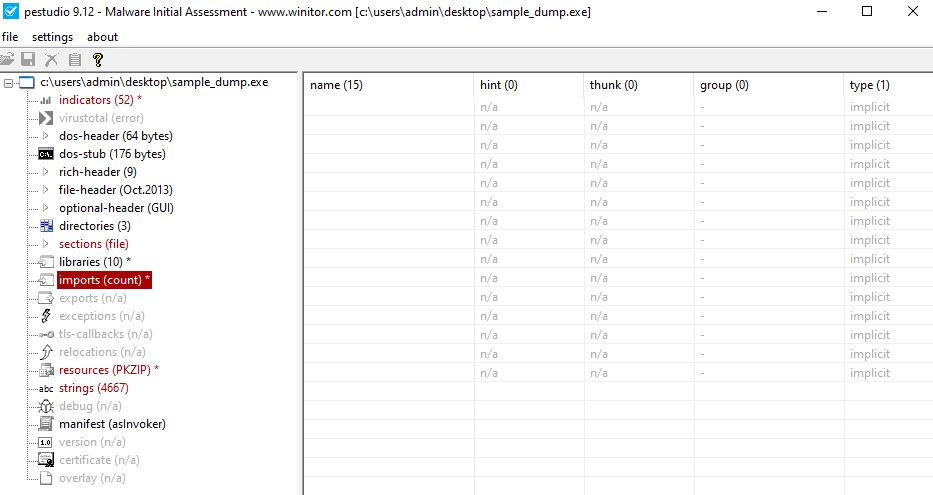
The dumped file is named as “sample_dump.exe”. Opening this file in PeStudio, will show you 15 imports with no name values. This is because the OllyDumpEx does not take care of rebuilding the imports while dumping it from memory. Imports on a file and imports in memory have different address offsets and this causes the dumped binary to be ‘incomplete’ in some ways as shown in the image below.
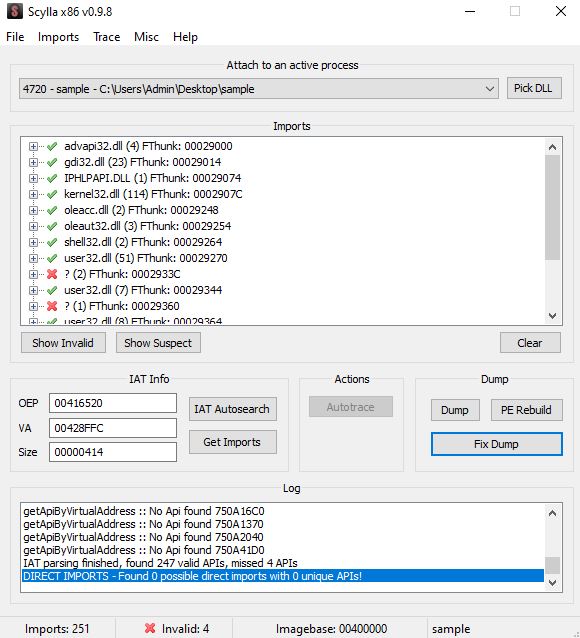
To rebuild the import table, we will use a different plugin - Scylla x86 [7] which searches for the Import Address Table in the packed binary and obtains the imports from it. Select “IAT Autosearch” and when prompted for advanced search choose no. The plugin will return with the starting address of the IAT. Now select “Get Imports” to obtain the list of imports for the binary.
In this case, it will return with 247 valid APIs and missing 4 APIs as shown below. If there were large number of missing APIs, try the advanced search mentioned earlier and check if it returns better results.
Once Scylla returns the above response, select “Fix Dump”, and this will generate a new file called “sample_dump_scy.exe”. As shown in the image below, opening “sample_dump_scy.exe” in the PeStudio shows that the imports are now populated.
Compare Figure 7 with Figure 9 to see how Scyllax86 helps with populating the imports. We have successfully extracted the UPX packed binary into a file “sample_dump_scy.exe”. We can now continue analayzing this sample for identifying its functionality and purpose. Subsequent posts will be focused on this.
References
- https://upx.github.io/
- https://www.virustotal.com/gui/file/1d2dcef824e0bfb28dc48732aa5ef8430f8f20436ab32428d6b7efe8ac715b2c
- https://github.com/horsicq/Detect-It-Easy
- https://github.com/wolfram77web/app-peid
- https://docs.microsoft.com/en-us/windows/win32/debug/pe-format
- https://low-priority.appspot.com/ollydumpex/
- https://github.com/NtQuery/Scylla